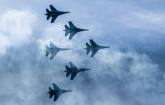
The Egyptian Defense Industry - Market Attractiveness and Emerging Opportunities to 2017: Market Profile
NEW YORK, March 5, 2013 /PRNewswire/ -- Reportlinker.com announces that a new market research report is available in its catalogue:
http://www.reportlinker.com/p01095578/The-Egyptian-Defense-Industry---Market-Attractiveness-and-Emerging-Opportunities-to-2017-Market-Profile.html#utm_source=prnewswire&utm_medium=pr&utm_campaign=Aerospace_and_Defense
Synopsis
This report provides a detailed analysis of the current industry size and growth expectations during 2012-17, including highlights of the key growth stimulators. It also benchmarks the industry against key global markets and provides detailed understanding of emerging opportunities in specific areas.
Summary
SDI's "The Egyptian Defense Industry - Market Attractiveness and Emerging Opportunities to 2017: Market Profile" is an essential source of information covering the market attractiveness and emerging opportunities of the defense industry in Egypt.
Egypt is a major non-TO ally of the US and, for the past three decades, has been receiving Foreign Military Financing from the US amounting to US$1.3 billion per year. This FMF makes up 80 percent of the country's defense capital expenditure and comes with a clause that requires the country to spend the entire amount on purchasing military equipment from American contractors.
ScopeReasons To Buy
"The Egyptian Defense Industry - Market Attractiveness and Emerging Opportunities to 2017: Market Profile" allows you to:
- Understand the market size and forecasts of the Egypt defense industry.
- Understand the budget allocation of the Egypt defense industry.
- Gain knowledge on Homeland Security market size and forecast.
- Gain insight into the benchmarking data with Key global markets.
- Understand the key trends and growth stimulators of the Egypt defense industry.
1 Introduction1.1. What is this Report About?1.2. Definitions1.3. Summary Methodology1.4. SDI Terrorism Index1.5. About Strategic Defence Intelligence (www.strategicdefenceintelligence.com)2 Market Attractiveness and Emerging Opportunities2.1. Defense Market Size Historical and Forecast2.1.1. Egyptian annual defense expenditure to reach US$4.15 billion by 20172.1.2. Perceived Threats and internal instability expected to drive defense expenditure2.2. Analysis of Defense Budget Allocation2.2.1. Egypt's defense expenditure expected to grow at a CAGR of 1.78% during the forecast period2.2.2. Share of capital expenditure in the overall defense budget to be maintained at an average of 7% during the forecast period2.2.3. Egypt's capital expenditure expected to remain constant during the forecast period2.2.4. The country is expected to spend US$18.36 billion on revenue expenditure over the forecast period2.2.5. The country's defense expenditure as per-capita defense spend declined over the review period2.3. Homeland Security Market Size and Forecast2.3.1. Egypt spent US$3.8 billion on internal security in 20112.3.2. Egypt is at a significant risk from external and internal threats2.3.3. Egypt experienced considerable terror activity during the review period2.4. Benchmarking with Key Global Markets2.4.1. Egyptian defense expenditure expected to increase at a CAGR of 1.78% during the forecast period2.4.2. Egypt ranks 41st in global defense spend2.4.3. Egypt allocates approximately 2% of its GDP for defense2.4.4. Egypt faces a substantial threat from foreign terrorist organizations2.5. Market Opportunities: Key Trends and Growth Stimulators2.5.1. Modernization of Naval and coast guard assets to drive naval defense procurements2.5.2. Procurement of modern armored vehicles, support vehicles, advanced weapon systems, and C4ISR systems to drive spending for the Land Forces2.5.3. Demand for air defense systems expected to increase as the replacement of obsolete systems continues2.5.4. Procurement of new systems and modernization of existing systems in the Air Force to create a robust demand2.5.5. Demand for unmanned aerial vehicle (UAV) is expected to surge during the forecast period2.5.6. Demand for patrol vessels is expected to increase3 Appendix3.1. About SDI3.2. Disclaimer
List of Tables
Table 1: Egyptian Defense Expenditure, 2008-2012
Table 2: Egyptian Defense Expenditure, 2013-2017
Table 3: Egyptian defense Budget Split Between Capital and Revenue Expenditure (US$ Billion), 2008-2012
Table 4: Egyptian defense Budget Split Between Capital and Revenue Expenditure (US$ Billion), 2013-2017
Table 5: Egyptian Defense Budget Allocation for Capital and Revenue Expenditure (%), 2008-2012
Table 6: Egyptian Defense Budget Allocation for Capital and Revenue Expenditure (%), 2013-2017
Table 7: Egyptian Capital Budget Allocation (US$ billion), 2008-2012
Table 8: Egyptian Capital Budget Allocation (US$ billion), 2013-2017
Table 9: Egyptian Revenue Budget Allocation (US$ billion), 2008-2012
Table 10: Egyptian Revenue Budget Allocation (US$ billion), 2013-2017
Table 11: Egyptian Defense Expenditure as Per-Capita Defense Spend (US$), 2008-2012
Table 12: Egyptian Defense Expenditure as Per-Capita Defense Spend (US$), 2013-2017
Table 13: Benchmarking with Key Markets - 2008-2012 vs. 2013-2017
Table 14: SDI Intelligence Terrorism IndexFigure 1: Egyptian Defense Expenditure, 2008-2012
Figure 2: Egyptian Defense Expenditure, 2013-2017
Figure 3: Egyptian defense Budget Split Between Capital and Revenue Expenditure (US$ Billion), 2008-2012
Figure 4: Egyptian defense Budget Split Between Capital and Revenue Expenditure (US$ Billion), 2013-2017
Figure 5: Egyptian Defense Budget Allocation for Capital and Revenue Expenditure (%), 2008-2012
Figure 6: Egyptian Defense Budget Allocation for Capital and Revenue Expenditure (%), 2013-2017
Figure 7: Egyptian Capital Budget Allocation (US$ billion), 2008-2012
Figure 8: Egyptian Capital Budget Allocation (US$ billion), 2013-2017
Figure 9: Egyptian Revenue Budget Allocation (US$ billion), 2008-2012
Figure 10: Egyptian Revenue Budget Allocation (US$ billion), 2013-2017
Figure 11: Egyptian Defense Expenditure as Per-Capita Defense Spend (US$), 2008-2012
Figure 12: Egyptian Defense Expenditure as Per-Capita Defense Spend (US$), 2013-2017
Figure 13: SDI Terrorism Heat Map, 2011
Figure 14: SDI Terrorism Index, 2011
Figure 15: Benchmarking with Key Markets - 2008-2012 vs. 2013-2017
Figure 16: Defense Expenditure of the World's Largest Military Spenders (US$ Billion), 2012 and 2017
Figure 17: Countries with the Largest Defense Expenditure as a Percentage of GDP (%), 2012
To order this report:: The Egyptian Defense Industry - Market Attractiveness and Emerging Opportunities to 2017: Market Profile
Contact Clare: [email protected]
US:(339) 368 6001
Intl:+1 339 368 6001
SOURCE Reportlinker
WANT YOUR COMPANY'S NEWS FEATURED ON PRNEWSWIRE.COM?
Newsrooms &
Influencers
Digital Media
Outlets
Journalists
Opted In


Share this article